
Cost Behind Cloud Metrics
In this post, we’ll evaluate managed Prometheus and the potential cloud costs associated with the Azure managed solution.
Azure Managed Prometheus Pricing Breakdown
Let’s start by creating a sample architecture to estimate the managed service costs for Prometheus.
Assuming a Kubernetes cluster is running under normal load, without heavy workloads or peak user activity, we’ll estimate the number of time series generated per job.
We’ll use the time series generated based on 1 node to simplify our calculation.
Note: To better understand time series, here is a good Stackoverflow post. Or alternatively…
# 1 Node Timeseries (TS)
kubernetes-apiservers: 2,948 TS
kubernetes-pods: 11,017 TS
kubernetes-nodes-cadvisor: 10,306 TS
kubernetes-service-endpoints (node exporter + KSM): 5,768 TS
kubernetes-nodes: 1,686 TS
kube-dns: 14 TS
etcd: 176 TS
prometheus: 43 TS
felix_metrics: 160 TS
kube_controller_metrics: 3 TS

TOTAL: 31,121 TS
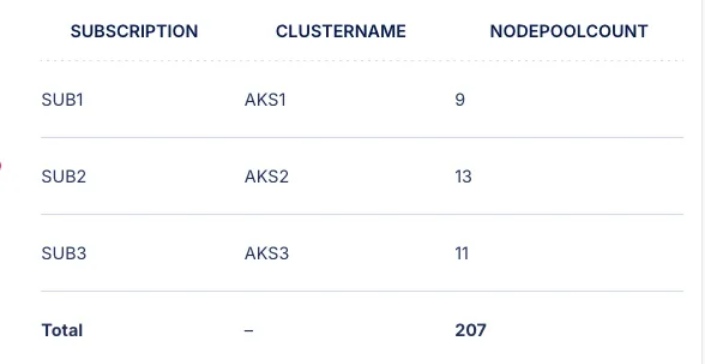
Using an Azure Resource Graph query, we identified our node pools
resources
| where type == ‘microsoft.containerservice/managedclusters’
| extend pools = properties.agentPoolProfiles
| project subscriptionId, clusterName = name, pool = pools
| mv-expand pool
| extend nodePoolCount = todouble(pool.[‘count’])
| summarize nodePoolCount = sum(nodePoolCount) by subscriptionId, clusterName
Query Processing and User Activity
Note: These are estimates for an average use case. Actual costs may vary depending onqueries and refresh interval!
Assumption:
10different users accessing Prometheus8graphs querying data per user60 secondsrefresh interval2 hours per user and day5,760is the total number of queries for8 graphs per day and user3 hourtimeframe for data visualisation
Calculations:
- Total daily queries:
5,760(10 users * 8 graphs * 72 queries per graph) - Highest samples processed in
3 hours: 867,303,720 - Average samples per query:
300,000
Monitoring and Alerting Query Processing:
- Monitoring query processing
~525,657,600,000(1) - Alerting query processing
~5,256,000,000,000(2)
Potential Cost
Time Series and Samples
- Time Series based on 200+ Nodes:
31,121 TS * 207 = 6,442,047 TS - Samples ingested per month:
~287 billion - Metric storage: Approximately
12GB - Total query volume:
~5,781 billion queries/month
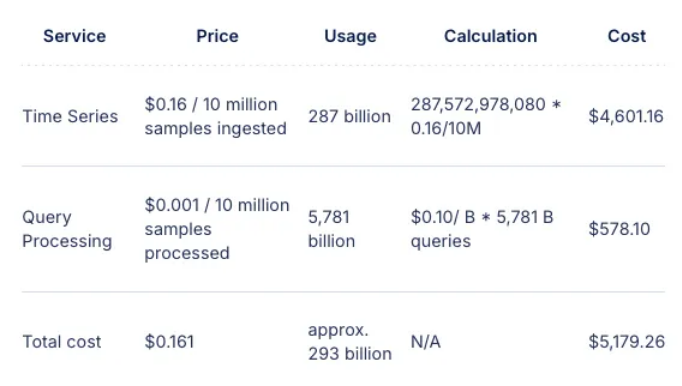
Approximately $5,179.26 per month
Conclusion
- Managed Prometheus is currently only available for AKS and Azure Arc-enabled Kubernetes (not VMs)
- Costs can escalate quickly depending on metrics, dashboards, and query usage
- A self-managed solution might be more cost-effective, though it requires initial setup time
References
- https://azure.microsoft.com/en-us/pricing/details/monitor/
- https://learn.microsoft.com/en-us/azure/azure-monitor/essentials/prometheus-metrics-overview#enable
- https://learn.microsoft.com/en-us/azure/azure-monitor/containers/prometheus-metrics-scrape-default
- https://learn.microsoft.com/en-us/azure/azure-monitor/cost-estimate